|
|
|
|||||||||||||||
 |
|||||||||||||||||
|
|||||||||||||||||












|
|
|
|
||||||||||||||||||||||||||||||||||
 |
|||||||||||||||||||||||||||||||||||||
|
This is a short tutorial on doing prospect evaluation applied to the Doba field. We focus on the main steps and the main concepts for using GeoX to evaluate prospectivity, risks and prospect economics.
Although we have chosen a typical development decision, the same procedure can be used in the context of for example evaluation of farm-in proposals or for assessing the potential of license-offerings as in the 3
rdCameroon round. We assume that you are reasonably familiar with prospect evaluation, concepts of uncertainty and
risk, and key notions from exploration project economics such as discounted cash flows (DCF) and net present value (NPV).
Consider the following decision situation: You need to decide whether or not to develop the Doba field. Doba is located in a mature area with proven hydrocarbon accumulations and will be developed
as an oil field. Prospect analysis is used to determine both how attractive the Doba field is in terms of oil & gas
potential and what the risks are that Doba might turn out to be non-economic. You also need to consider what is the potential return from an investment in a development of Doba. The outputs of
your analysis of Doba are therefore an estimate of the likely quantities of oil and the risk that Doba might turn out to be non-economic. The technical analysis is complemented with an estimate of the
full cycle discounted cash flow that considers both the costs of drilling and the revenues with costs should the discovery be transformed into a producing field.
The main data required for the technical analysis of the Doba field will include:
For an economic analysis of the field's potential, the main data required will include:
Each of these data items will be reviewed in on the following pages. The review covers only the main data items that need to be entered. It does not cover all options and it does not cover data items
that are not relevant for a simple, rapid initial analysis of the Doba case.
You might find it useful to follow the prospect tutorial using GeoX/Starter. Before you begin, it is useful to note the following :
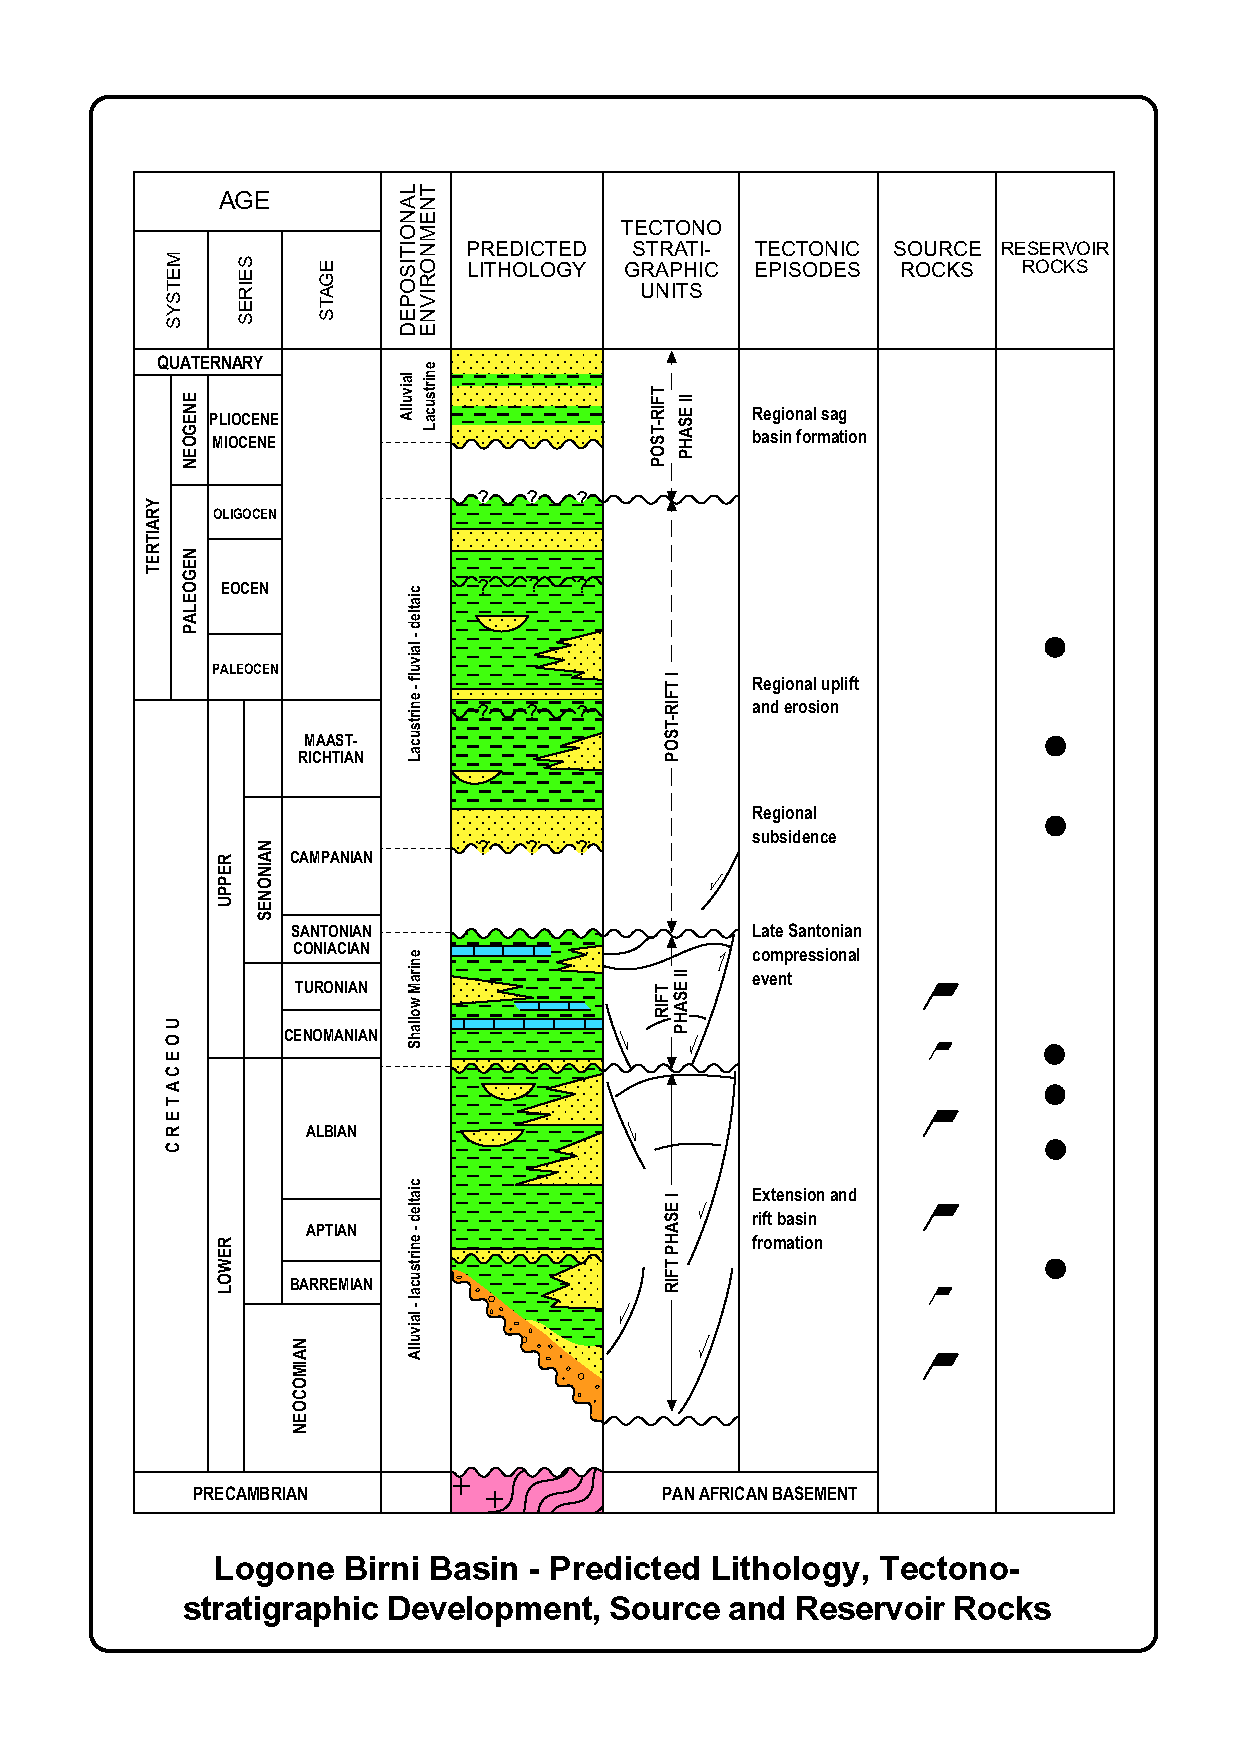
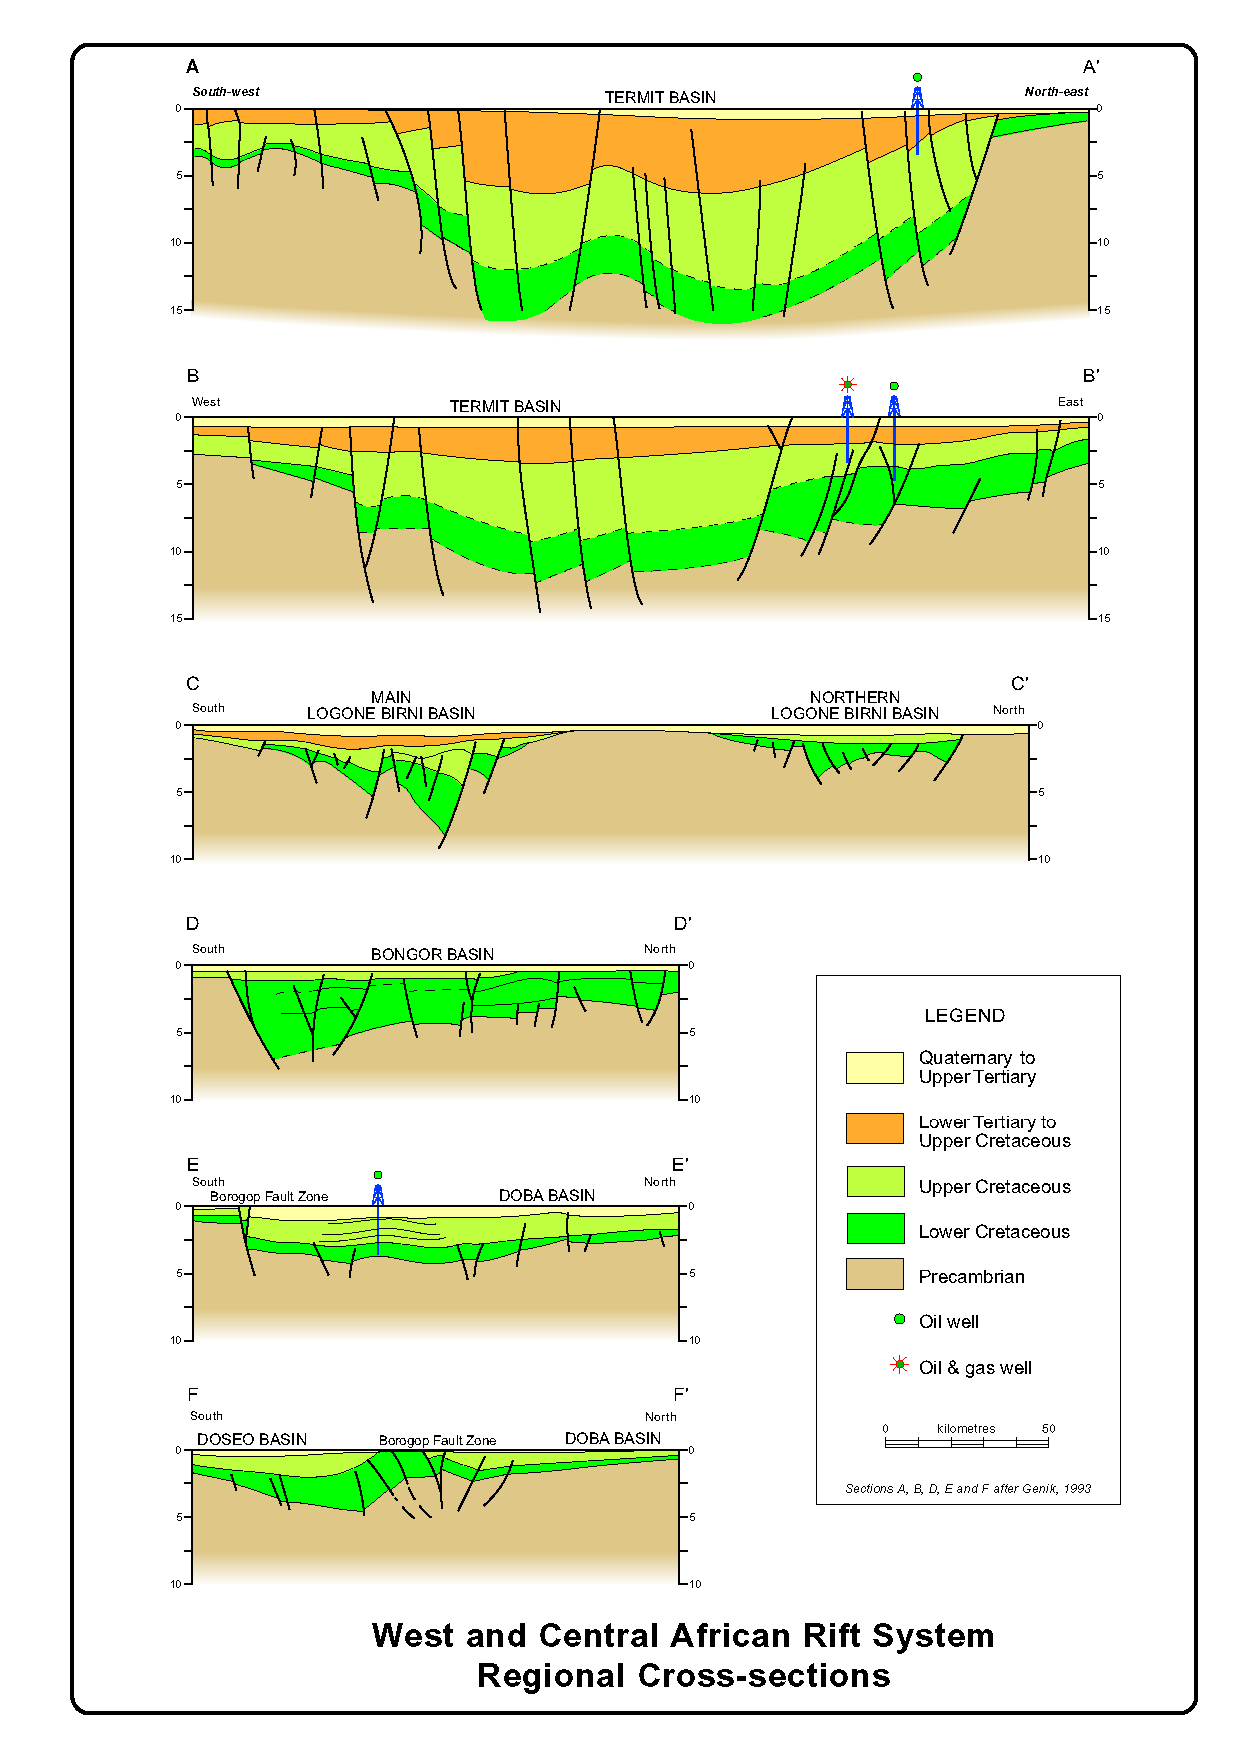
The Doba basin of southern Chad form an extensive intra-continental rift network, initiated by early Cretaceous extension related to continental break-up and ultimately to the formation of
the South Atlantic Ocean. The Doba basin extends along the trend of the Central African Fault Zone, through southern Chad, central Sudan and into Kenya, known as the Central African Rift
Sub-system. These are both extensional and trans-tensional in origin, containing up to 7,500 m of mainly Lower Cretaceous, continental deposits. Much of the Cretaceous rift sediments are
concealed below post-rift late Tertiary and Quaternary cover. In the southern Chad basins, sedimentation during the first rift phase proceeded from Barremian
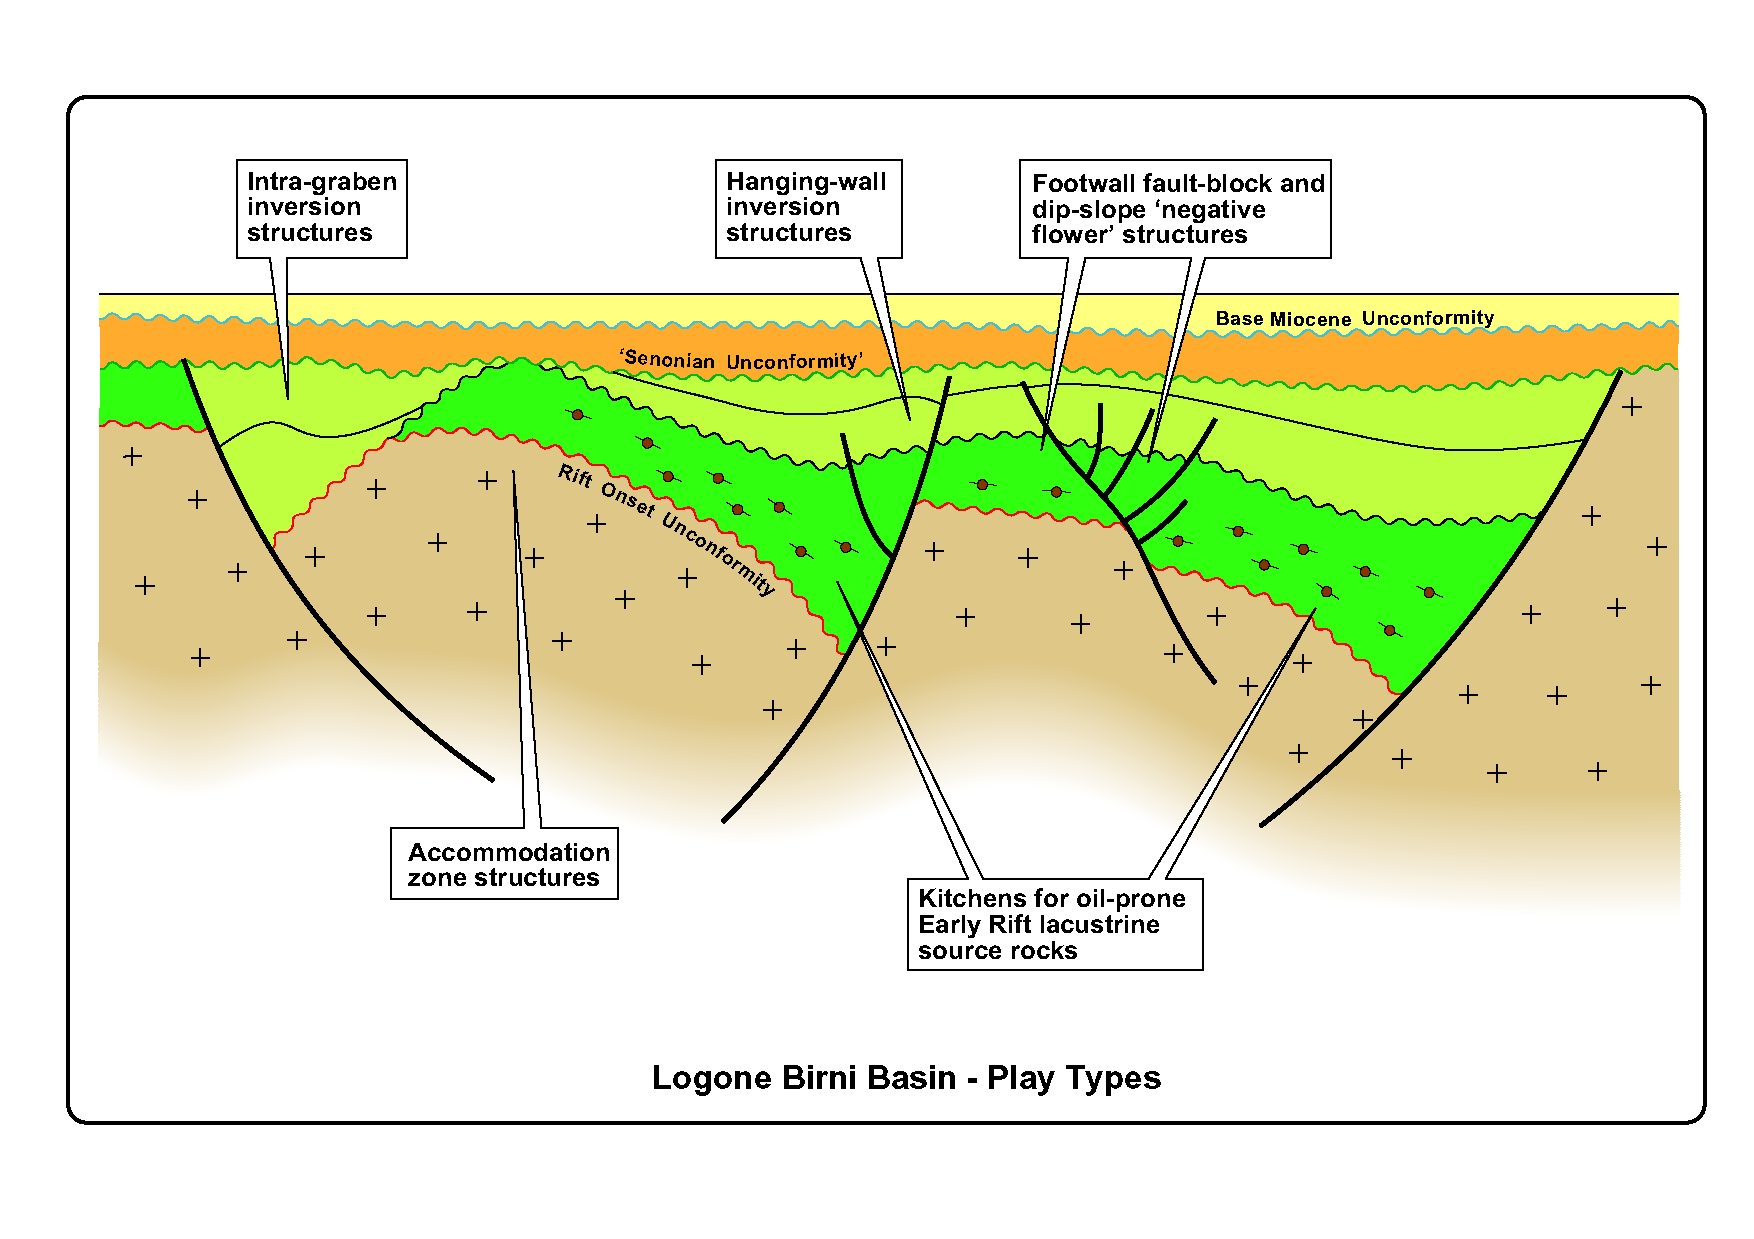
to Albian times with deposition of up to 5000 m of continental alluvial, fluvial and lacustrine clastic sediments. The second rift phase terminates against the 'Senonian' unconformity,
separating deformed Rift Phase I and II sections from a generally flat lying younger section. In the Doba basins strike-slip movements caused major trans-pressional disruption at this time.
Significant episodes of regional inversion, uplift and erosion occurred during the late Cretaceous and early Tertiary. The Adamawa region was uplifted along the line of the Neogene to
Quaternary Cameroon volcanic trend, causing the removal of up to 2,500 m of Upper Cretaceous and Lower Tertiary section from the region around the western Doba and Bongor basins.
The Doba basin contain predominantly coarse clastic sediments, with proven reservoir quality in Lower Cretaceous fluvial, lacustrine and deltaic sands, Upper Cretaceous fluvial, marginal lacustrine and shallow marine sands, and Eocene fluvial sands.
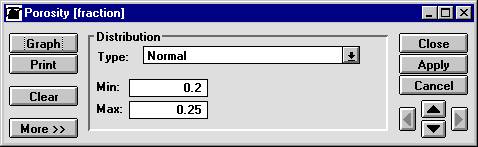
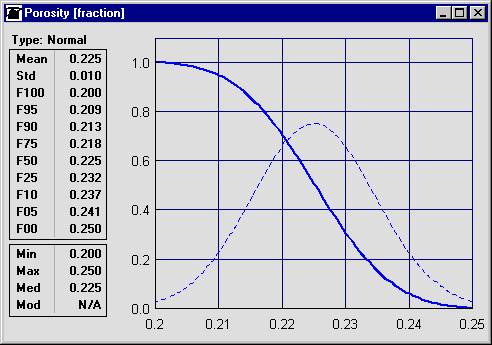
As you surely are aware of, petroleum exploration is a risky business. On a worldwide basis, four of five wildcats are dry. Similarly, there is often a great deal of uncertainty in terms of estimates of the size of accumulations. As upside potential is often the key to prospect economics, accurate estimation of both downside and upside are equally important. For consistent, accurate and realistic assessment of exploration risks, we decompose overall risk into distinct and independent risk factors. For uncertainty in resource estimates, we attempt to state explicitly uncertainties in the estimates used to calculate hydrocarbon potential. In very simple terms, uncertainty is stated by defining not only your best estimate of prospect attributes such as area of closure, thickness, porosity and trap fill, but by also defining a range of values with their likelihood of occurrence. The resulting range of values with their likelihood represents the probability distribution of the parameter estimate. Consider reservoir rock porosity. Let us assume that the estimate of the most likely value for the porosity of the Doba reservoir is 22.5%. Pressing the explorationist involved in the Doba case for a lower bound on the porosity, you ask for an estimate of the porosity value that he is sure that the Doba reservoir is above. He replies 20%. You then press for an upper bound on the porosity. He replies that he is confident that the porosity cannot under any circumstances be 25% or above. The 20 to 25% range for the porosity with a most likely value of 22.5% can be said to define a normal frequency distribution. You enter this value in the parameter input panel (PIP) for the porosity by selecting a normal distribution and entering a minimum value of 20%, a maximum value of 25% .
The graph of the distribution that is displayed when you click the Graph button shows not only the frequency distribution (dotted line), but also the cumulative probability distribution (continuous line) for your estimate of the Doba reservoir porosity.
The cumulative probability distribution shows the probability of the reservoir porosity being equal to or greater than a porosity value. Here the cumulative distribution shows that there is a probability of 1 (certainty) that the porosity is 20% or greater while there is a zero (0) probability that the porosity is equal or greater than 25%. Calculate results Once you have reviewed and edited all the input parameter estimates that are relevant for the Doba oil case, click the CALC toolbar button or press F9. The system computes estimates of in-place and recoverable resources. You review the output by browsing the result pages.
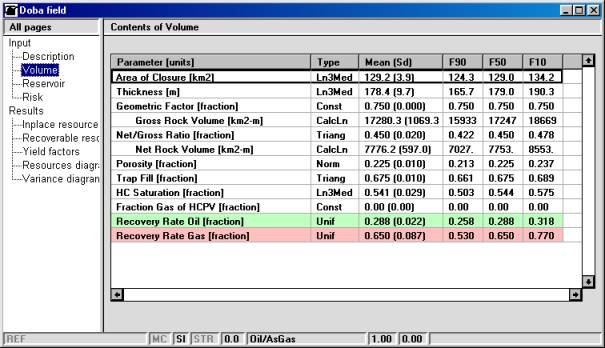
Once you have created a new prospect analysis, you enter the volume and reservoir parameters on the volume and reservoir notebook pages. We start with the volume parameters that are used to calculate the hydrocarbon pore volume. The volume parameter page also includes your estimates of recovery factors. For the Doba case, the following estimates have been provided : gross rock volume is 200 1000 acres-feet, the net/gross ratio is 40%, the porosity is 12%, the trap fill is 100% and the hydrocarbon saturation is 85%. The estimated oil recovery factor is 35%. The new analysis is populated with default values for all parameters. As Doba is an oil case, you only need to edit the following parameters on the volume page: As Doba is assumed to be an oil case, you need to make sure that the % gas of Hydrocarbon pore volume (gas%HCPV) is set to 0 (a constant). As we covered in the previous section, uncertainty in the porosity estimate has been described by a normal distribution where the best estimate is the most likely value, while your explorationist evaluates that 20 % is an absolute minimum and 25 % is an absolute maximum value. For the other parameters, you enter as a constant – implying that there is no uncertainty in the estimate. Or you can signal uncertainty by entering minimum and maximum values that imply a certain range in the estimate. Assume that you have no reason to expect any value in the estimates to be more likely and that there is a 13% range on recovery rate. Assuming that all values are equally likely implies using a uniform distribution that is defined by the minimum and maximum values. A ± 13% range implies entering for example a minimum of 25% and a maximum of 32.5% for the recovery rate.
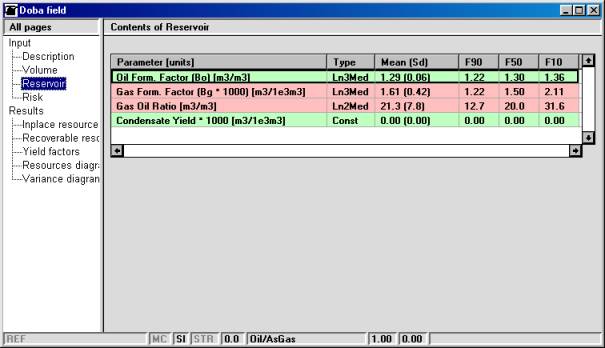
Reservoir parameters define how hydrocarbon pore volume estimates are transformed into estimates of surface volumes of oil and gas. They also define the factors that are used to calculate quantities of associated gas and condensate. For the Doba case, the following estimates have been provided for the two parameters that you need to estimate for an oil case : the oil formation volume factor (Bo) is 1.23 and the Gas-Oil Ratio (GOR) is 200 scf/STB. Again, you can enter each parameter estimate as a constant – implying that there is no uncertainty in the estimate. Or you can signal uncertainty by entering minimum and maximum values that imply a certain range in the estimate. Assume that you have no reason to expect any value in the estimates to be more likely and that there is a 10% uncertainty range on all parameters. You therefore enter the estimates as 3 parameter lognormal distributions with the oil formation volume factor as median value of 1.3 varying from 1.1 to 1.4 and the GOR as 2 parameter lognormal distributions with median value of 112.3 and a maximum at 280.75
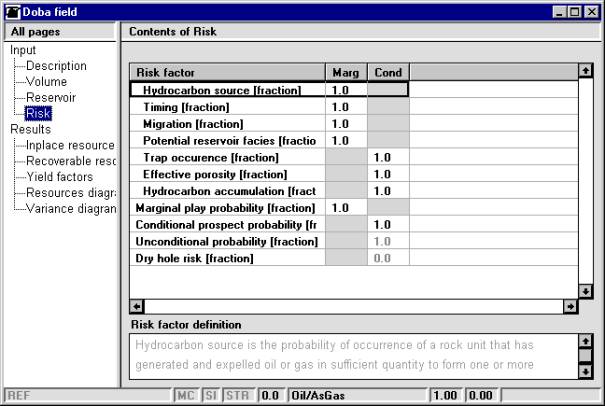
Risking is critical. The basic GeoX analytical risk model supports a consistent and systematic analytical approach to risking across prospects in a play. You do this by distinguishing between risk factors that are common to all prospects in the play and conditional risk factors that can vary from prospect to prospect. The default value for all risk factors is 0. As a result, if you do not edit the risk factors, the risked resource estimates will also be 0. In the standard GeoX risk model, there are four risk factors that are assumed to be common to all prospects in a play: probability of source rock, probability of migration, probability of timing and probability of reservoir presence. Given that Doba is in a play that has proven hydrocarbon accumulations, all the common (marginal) risk factors should be set to 1.
There are three conditional risk factors: probability of adequate trapping, probability of reservoir quality and probability of hydrocarbon accumulation. The conditional factors are estimated assuming that the common factors are all OK.
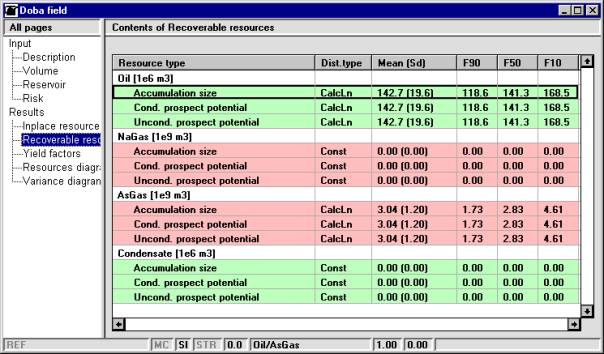
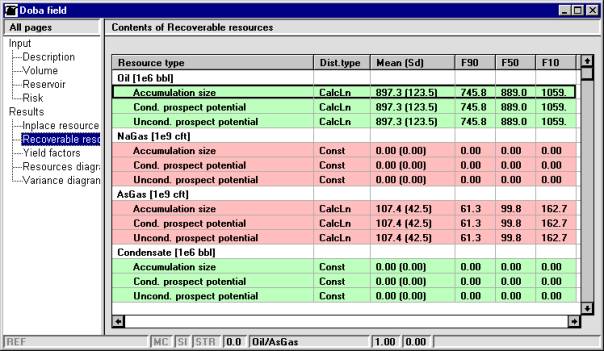
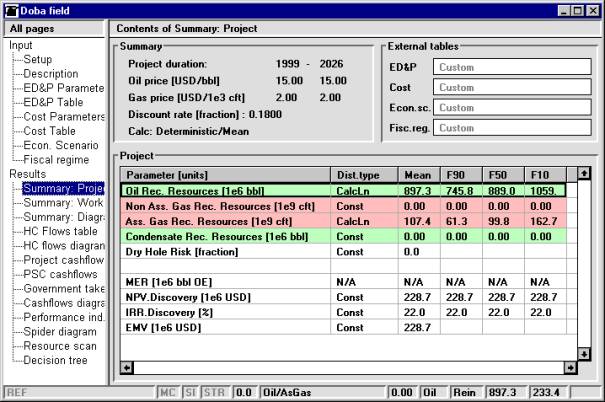
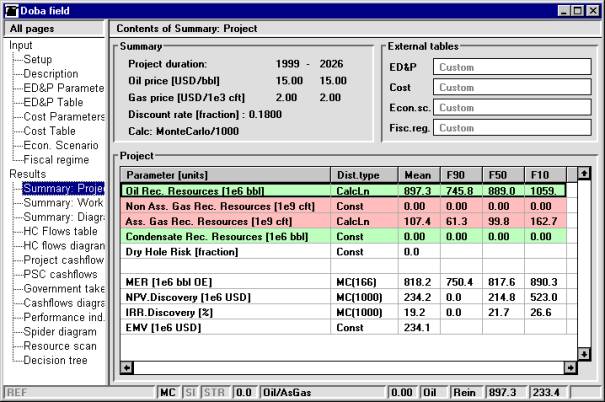
The in-place and recoverable resources pages have the same format. They show for each hydrocarbon phase, the unrisked and risked estimates of resources. The conditional risked estimate considers only the conditional, prospect level risk while the unconditional risked estimate also considers the common, marginal play-level risk. In the Doba case, the marginal risk is 1 and therefore the conditional and unconditional estimates are identical. The mean expected recoverable oil resources are 897.3 MBBL with a 10% chance of a 1059 MBBL field.
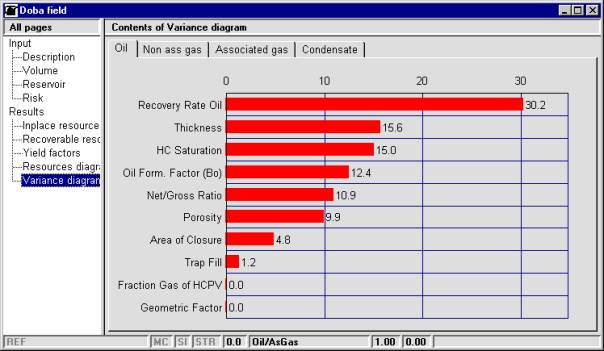
Other result pages show the contribution of the different input parameter estimates to the uncertainty in the calculated resource estimates (variance diagram), the reservoir yield factors (yield) and a graphical display of the total hydrocarbon resources in oil equivalents (resource diagram). For example, the variance diagram for recoverable oil indicates that uncertainty in your recovery estimates account for 30.2% of the variance in the calculated recoverable oil resources.
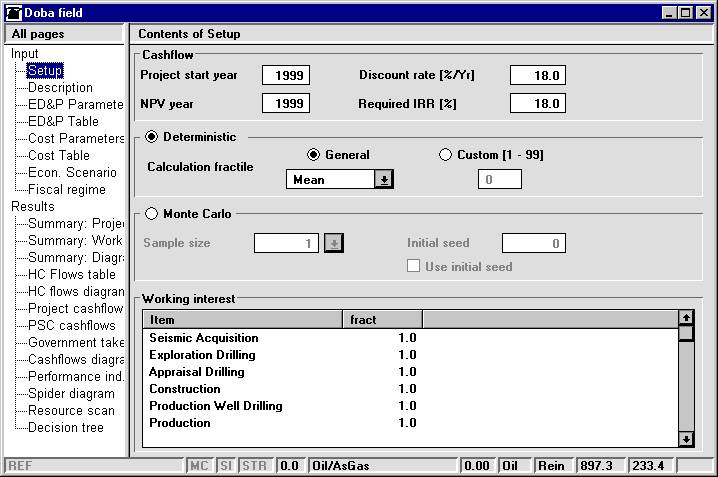
You are now ready to evaluate the economic potential of the Doba field. Select the full cycle analysis using the window command and browse to the setup page in the gFullCycle notebook.
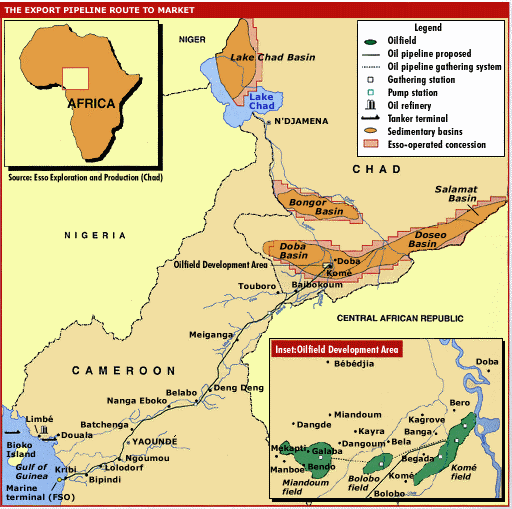
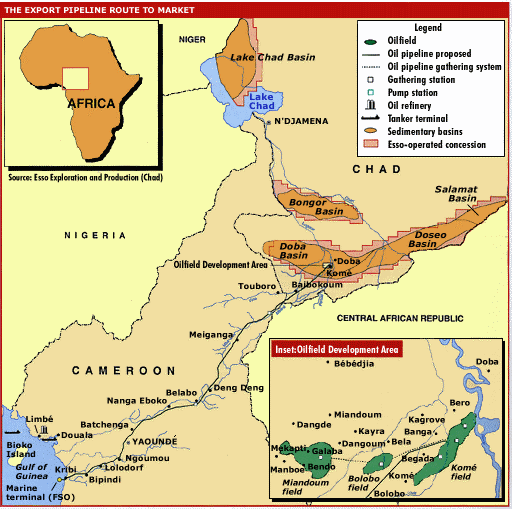
In November 1996, the Esso-consortium and the Chadian government signed a memorandum of understanding (MOU) concerning development terms for the Doba Basins fields. This MOU followed the conclusion of a bilateral treaty between Chad and Cameroon that provided the basis for construction and operation of the accompanying export pipeline to an offshore terminal near Kribi. The upstream development will cost slightly less than half of the project's total cost ($3bn) and will entail drilling about 300 production and 20 re-injection wells in the Komé, Bolobo and Miandoum fields. Only two or three rigs will be active in the Komé region, even at the height of drilling activities, because, on average, each well will be drilled in less than a week.
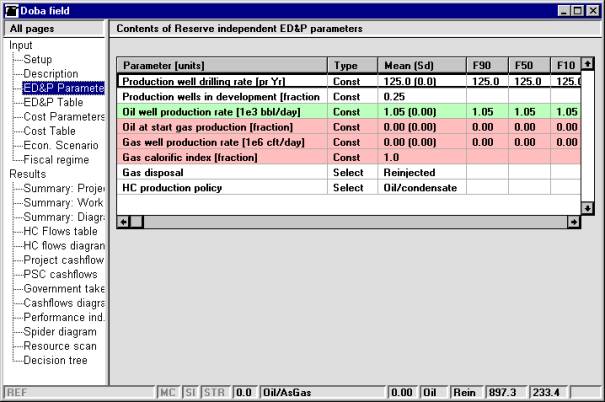
The ED&P (exploration, development and production) parameters define the duration of the different phases of the exploration project from seismic acquisition through exploration and appraisal to field development and production. The ED&P parameter also define the activity levels in the different phases. In particular, the parameters are used to generate a hydrocarbon production profile. The effective production well drilling rate, the proportion of wells drilled prior to start of production and the effective initial oil production rate are parameters defined in the reserve independent ED&P parameter page, while the other parameters are set in the reserve dependent ED&P table page. For the Doba oil case, you have the following estimates for the relevant parameters that need to be edited: effective production well drilling rate is 125 wells pr. year, 25% of the production wells are drilled prior to start of production and the initial effective production rate of a single well is 1050 bbl/day
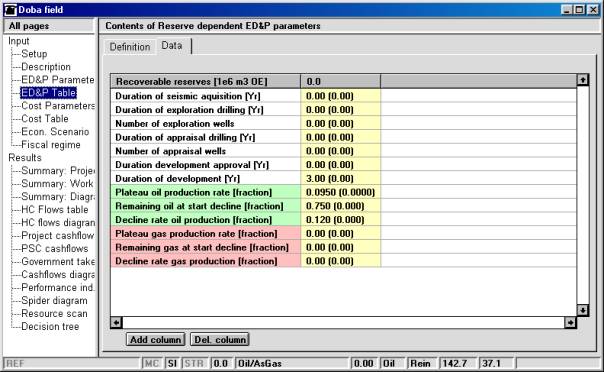
Because we have a discovery the initial seismic campaign will be set to 0 months, the single exploration well will be set to 0 months, while the single appraisal well will be set to 0 months and field development is planned to take 3 years. The plateau production rate is estimated to be 9.5% of recoverable reserves. Production will start declining when 75% of recoverable reserves remain and the decline rate is 12% pr. year. You also need to indicate that associated gas is re-injected in the reserve independent parameter page as only oil is sold. Again, you can enter each parameter estimate as a constant – implying that there is no uncertainty in the estimate. Or you can signal uncertainty by entering minimum and maximum values that imply a certain range in the estimate
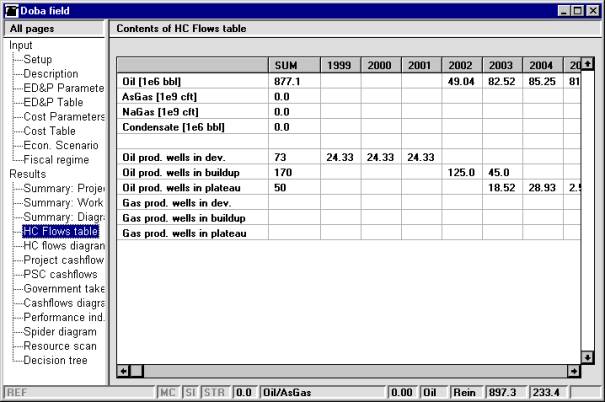
The HC Flow table page provides the same information in table format.
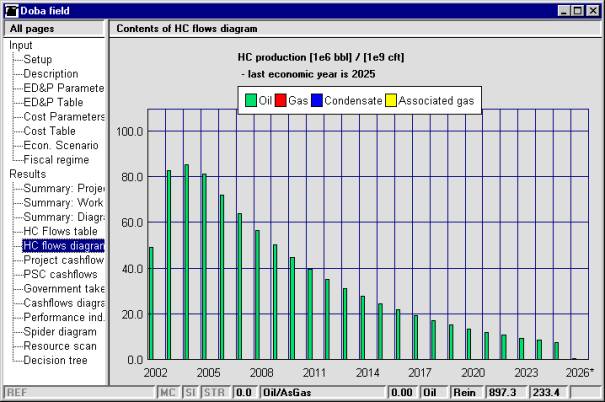
In addition, the HC Flow table page shows the production well drilling profile. You note that the plateau rate of 85.25 million bbls/year (233400 bbls/day) requires 293 wells.
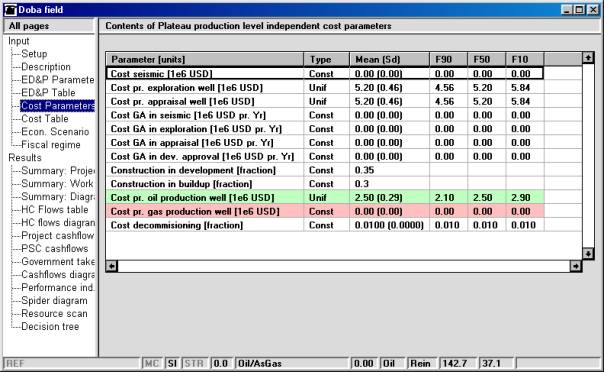
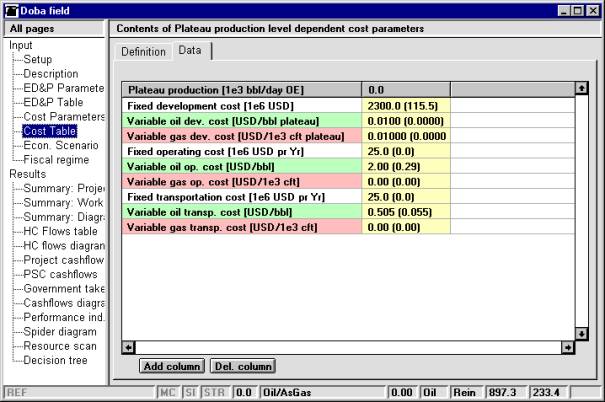
Now that you have an acceptable activity profile, you need to edit the unit activity cost parameters. The costs of seismic, exploration wells, appraisal wells and production wells are defined on the plateau production level independent cost parameter page, while the field development costs other than drilling costs and operating costs are defined on the plateau level dependent cost table page. The following cost estimates apply for the Doba case: cost of seismic is zero because these are sunken costs for the Doba discovery, cost per exploration well is 5.2 million USD, cost per appraisal well is 5.2 million USD but none of these will have an effect because the duration of these activities were set to zero. Cost pr. oil producer is 2.5 million USD.
Fixed development costs are 2300 million USD. Development costs as a function of the plateau production level are 0.01$ pr bbl plateeau , while operating costs have a component that varies with the oil production level 2$ bbl and the fixed operating cost is 25 million USD pr year.
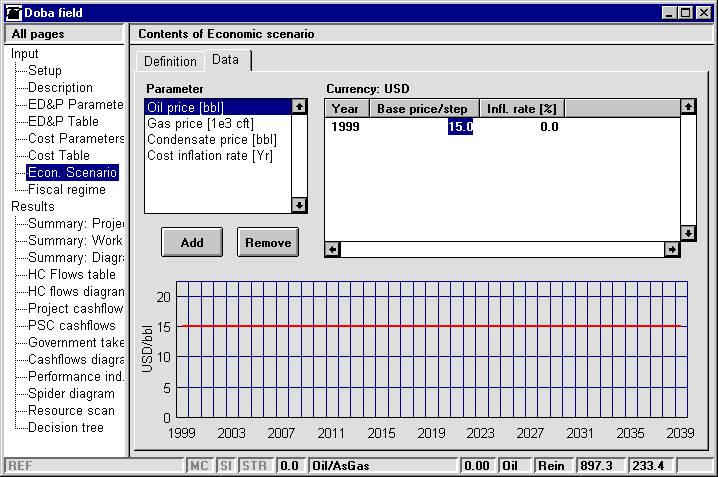
The economic scenario page is used to define the future price level of hydrocarbon products. It is also used to define assumptions concerning cost inflation. Economic scenario parameter estimates are entered directly in the notebook page. For the Doba field, let us assume that your current estimate is an oil price at USD 14 pr, bbl until 2001 and thereafter a 1% yearly price increase. You select oil price in the scenario item list, and edit in 15 in the base price column and 0% in the inflation rate column. You can add another element by clicking Add, set the date at xxxx, edit in x in the step column and x% in the inflation rate column if you want a more complex price scenario.
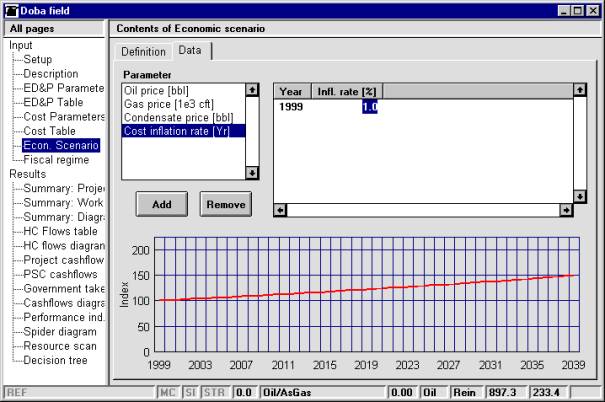
You select the cost inflation item and edit in a 1% yearly cost inflation rate.
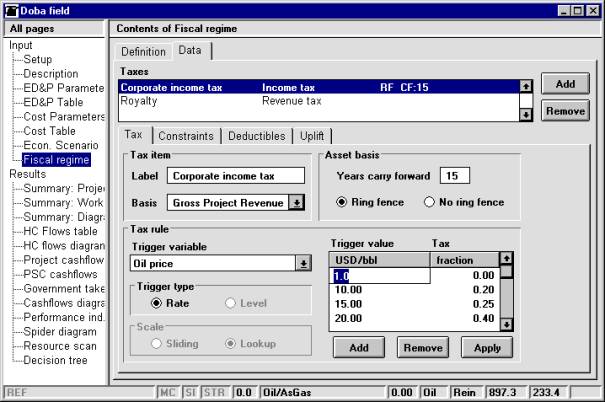
Fiscal regimes worldwide typically appropriate a significant proportion of the net value created in petroleum exploration projects. Accurate modeling of fiscal conditions is therefore important. GeoX provides flexible functions for modeling all possible fiscal regime components. You can model not only income taxes, but also revenue taxes, production taxes, project fees and production sharing contracts (PSC). For the Doba case we consider a corporate income tax (25%) if the oil price is from 15$ to 20$ and 40% if the oil price is 20$ or more and royalty (5%) for production up to 273784 bbl a day. For income taxes, OPEX is expensed and CAPEX is expensed according to a 5-year, linear depreciation schedule. The tax has four sub-pages. You need only consider the tax and depreciation sub-pages. Select the tax subpage, make sure that gross revenue is the tax basis, set the trigger to "oil price" and edit in the 3 tax rate in the tax rule table. Also note that the project is ring fenced and that there is a 15-year carry-forward. Now select the depreciation subpage, select CAPEX in the expenses and tax list, move it to the deductible items list and then select the linear depreciation type in the depreciation rule table (by clicking the item in the table). Edit in the 5-year depreciation rate in the years column. Similarly, select OPEX in the expenses and tax list and move it to the deductible items list. You do not need to edit the OPEX depreciation rule as expensed is the default setting.
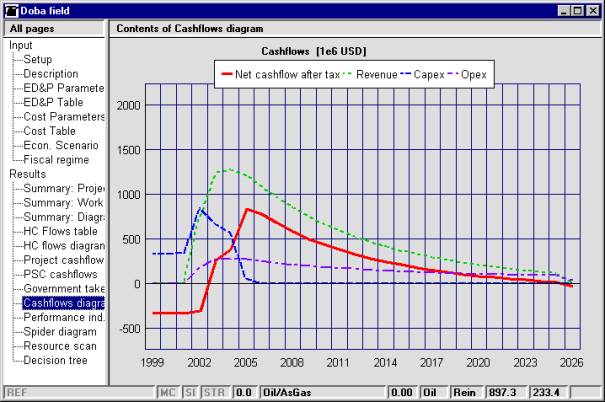
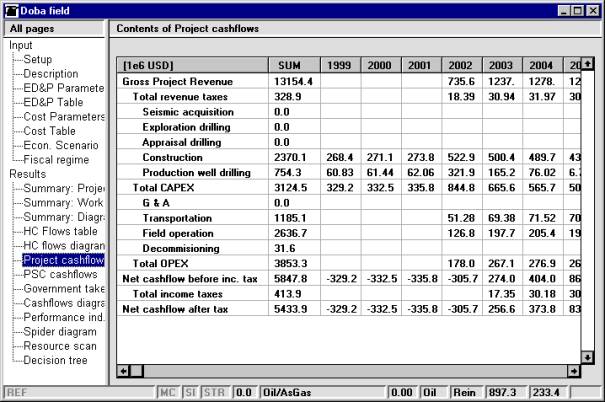
Browse the main cash flow results by accessing the project cashflows page. The left-most column gives the sum of the different cost and revenue elements, while you can scroll the whole project life cycle using the scroll bars on the notebook page. The timing of the cost items should mirror your ED&P activity modeling and the cost levels should mirror both activity levels and activity costs.
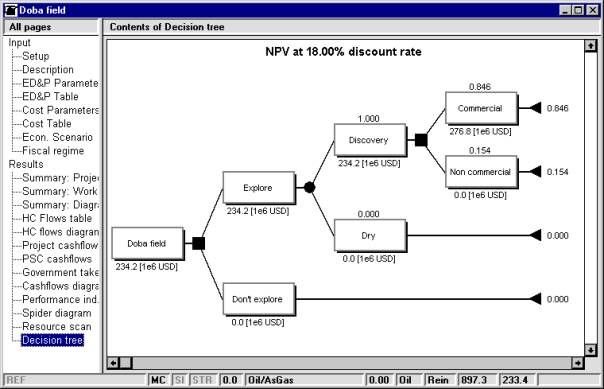
The EMV (expected monetary value) is the estimated monetary value given an outcome of the costs associated with drilling a dry well times the dry hole risk and the estimated NPV times (1 – the dry hole risk). The after-tax NPV for the mean resource estimate of 897 million barrels is 228.7 million USD and the after-tax EMV is also 228.7 million USD because dry hole risk is zero.
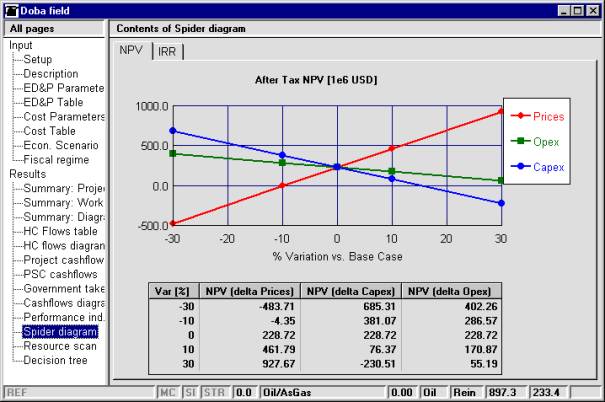
The spider diagram indicates how sensitive the calculated NPV and IRR estimates are to your assumed input estimates for oil prices, total CAPEX (capital expenditures) and total OPEX (operating expenditures).
The sensitivity analysis on the initial review suggests a relatively marginal project at 15$ oil price, as after tax returns are zero at less than 10% reduction concerning oil prices.
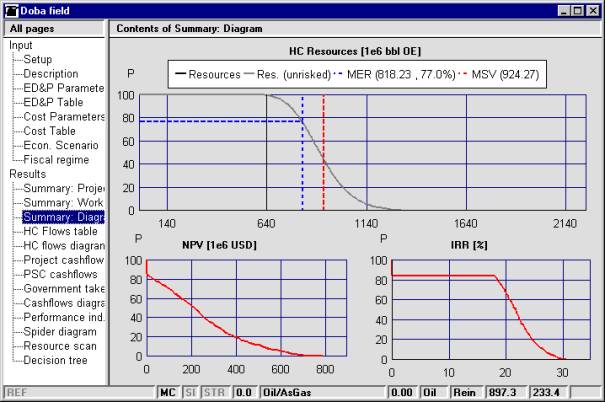
To get an integrated review of the Doba field uncertainties, do a Monte Carlo sampling of the full distribution of alternative resource outcomes. Select the stochastic estimation on the Setup page. Also set the required IRR (the internal rate of return required for a discovery to be developed) to 18%. Press F9 or click the CALCULATE button to start the Monte Carlo estimation. The system displays a panel that shows how the simulation is progressing. Once completed, browse the Summary table and the Summary diagram pages to review the full cycle, integrated uncertainty evaluation of the Doba field. The results will in part depend on what uncertainties you have assigned to the different full cycle input parameter estimates.
|
|||||||||||||||||||||||||||||||||||||